The Most Important Indicators Every Trader Should Know
Introduction
Trading in financial markets requires a solid understanding of various tools and techniques to make informed decisions. One of the most crucial aspects of trading is the use of indicators. These tools help traders analyze price movements, identify trends, and make profitable decisions. In this article, we will explore the most important indicators that every trader should know.
1. Moving Averages (MA)
Moving averages are among the most widely used indicators in trading. They help smooth out price fluctuations and identify trends over a specific period.
Types of Moving Averages:
- Simple Moving Average (SMA): The average of closing prices over a set period.
- Exponential Moving Average (EMA): Gives more weight to recent prices, making it more responsive to price changes.
How to Use Moving Averages:
- A price above the moving average indicates an uptrend.
- A price below the moving average suggests a downtrend.
- The crossover of short-term and long-term MAs can signal buy or sell opportunities.
2. Relative Strength Index (RSI)
RSI is a momentum oscillator that measures the speed and change of price movements. It ranges from 0 to 100 and helps identify overbought and oversold conditions.
How to Use RSI:
- An RSI above 70 suggests overbought conditions (possible price correction or reversal).
- An RSI below 30 indicates oversold conditions (potential price rebound).
- RSI divergence (price moving opposite to RSI) can signal trend reversals.
3. Moving Average Convergence Divergence (MACD)
MACD is a trend-following momentum indicator that shows the relationship between two moving averages.
Components of MACD:
- MACD Line: Difference between the 12-day and 26-day EMA.
- Signal Line: 9-day EMA of the MACD line.
- Histogram: Shows the difference between MACD and the signal line.
How to Use MACD:
- A bullish crossover (MACD crosses above the signal line) signals a buying opportunity.
- A bearish crossover (MACD crosses below the signal line) suggests selling.
- Histogram bars growing in height indicate increasing momentum.
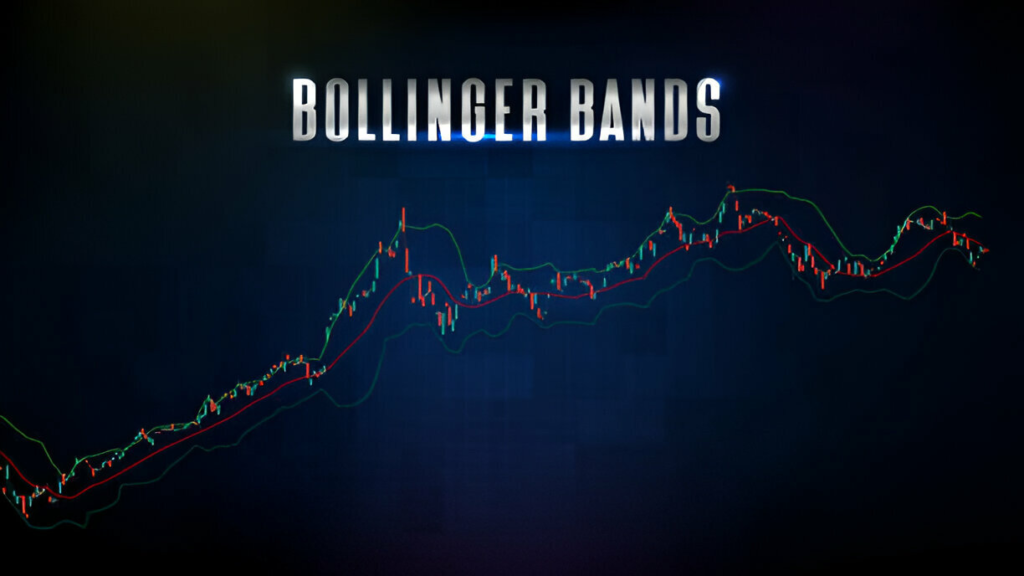
4. Bollinger Bands
Bollinger Bands consist of three lines:
- Middle Band: A simple moving average (SMA).
- Upper Band: SMA + (2 × standard deviation of price).
- Lower Band: SMA – (2 × standard deviation of price).
How to Use Bollinger Bands:
- Prices touching the upper band may indicate overbought conditions.
- Prices touching the lower band may suggest oversold conditions.
- A squeeze (narrowing bands) signals potential volatility expansion.
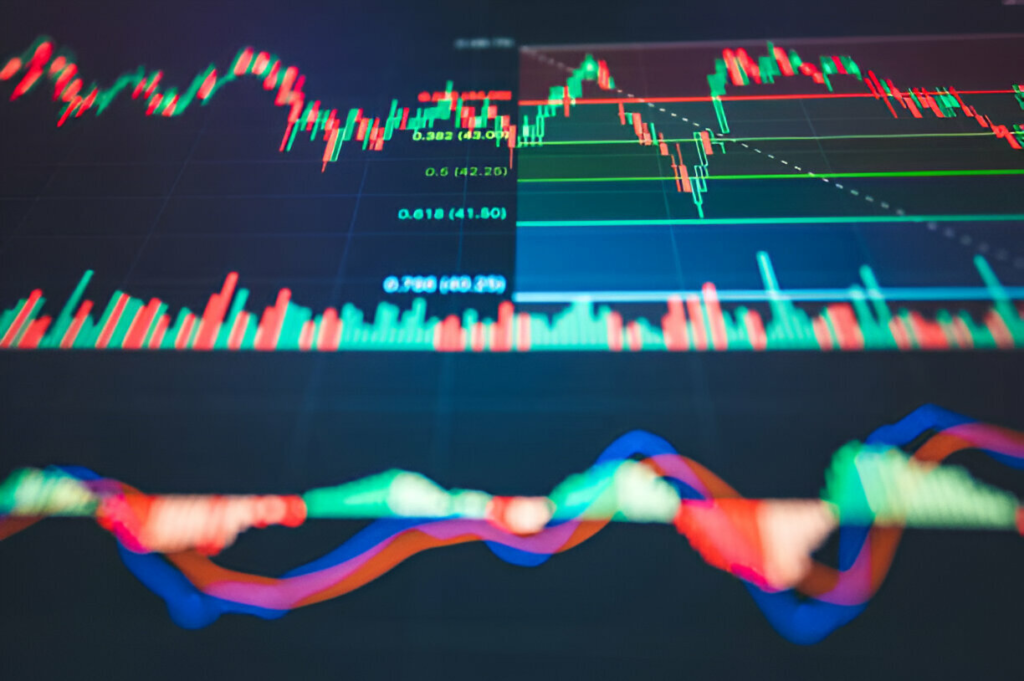
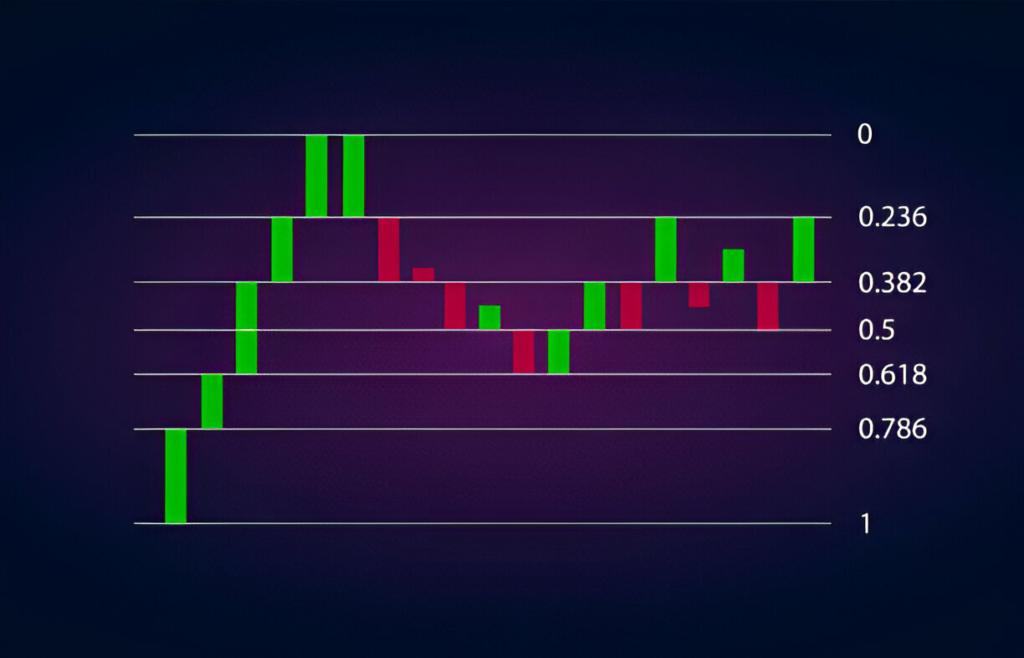
5. Fibonacci Retracement
Fibonacci retracement is a tool used to identify potential reversal levels based on key Fibonacci ratios (23.6%, 38.2%, 50%, 61.8%, and 78.6%).
How to Use Fibonacci Retracement:
- Draw the retracement from a significant high to a significant low.
- Price bouncing from Fibonacci levels can indicate strong support or resistance zones.
- Used in conjunction with other indicators for confirmation.
6. Stochastic Oscillator
The Stochastic Oscillator is a momentum indicator that compares the closing price of a security to its price range over a specific period.
How to Use the Stochastic Oscillator:
- Readings above 80 indicate overbought conditions.
- Readings below 20 suggest oversold conditions.
- A crossover of %K and %D lines can indicate buy or sell signals.
7. Average True Range (ATR)
ATR measures market volatility by calculating the average range between high and low prices over a set period.
How to Use ATR:
- A high ATR indicates high volatility.
- A low ATR suggests low volatility.
- Used to set stop-loss levels based on market volatility.
8. Volume Indicators
Volume is a critical aspect of trading, as it shows the strength behind price movements. Some popular volume indicators include:
- On-Balance Volume (OBV): Measures buying and selling pressure based on volume changes.
- Volume Weighted Average Price (VWAP): Helps identify the average price a security has traded at throughout the day, adjusted for volume.
- Chaikin Money Flow (CMF): Measures the flow of money into and out of a security.
How to Use Volume Indicators:
- Increasing volume with price movement confirms trend strength.
- Decreasing volume with price movement signals potential trend reversal.
9. Ichimoku Cloud
The Ichimoku Cloud is a comprehensive indicator that provides trend direction, support/resistance levels, and momentum.
Components of the Ichimoku Cloud:
- Tenkan-sen (Conversion Line): Short-term trend indicator.
- Kijun-sen (Base Line): Medium-term trend indicator.
- Senkou Span A & B: Form the cloud and indicate future support/resistance.
- Chikou Span (Lagging Line): Helps confirm trends.
How to Use Ichimoku Cloud:
- Price above the cloud suggests an uptrend.
- Price below the cloud indicates a downtrend.
- A cloud breakout can signal strong trend reversals.
Conclusion
Understanding and utilizing trading indicators effectively can significantly improve a trader’s ability to make informed decisions. While no single indicator guarantees success, combining multiple indicators can enhance trading strategies and risk management. Successful traders continuously analyze market conditions and adapt their strategies accordingly.
FAQ
1. What is the best trading indicator for beginners?
Moving Averages (MA) and Relative Strength Index (RSI) are great for beginners due to their simplicity and effectiveness.
2. Can I rely on one indicator for trading decisions?
No, it’s recommended to use a combination of indicators to confirm signals and improve accuracy.
3. How often should I check indicators while trading?
It depends on your trading style. Day traders monitor indicators frequently, while long-term traders analyze them periodically.
4. Are trading indicators useful for all markets?
Yes, indicators work across various markets, including forex, stocks, commodities, and cryptocurrencies.
5. Do trading indicators guarantee profits?
No, indicators provide insights, but successful trading requires risk management, discipline, and experience.
By mastering these indicators, traders can develop well-rounded strategies and navigate the markets with greater confidence.