Technical vs Fundamental Analysis: What’s the Difference?
Introduction
When it comes to investing and trading in financial markets, two primary approaches dominate: technical analysis and fundamental analysis. Both methodologies offer unique insights into market movements, but they differ significantly in terms of strategy, data interpretation, and application. Understanding these differences is crucial for traders and investors aiming to develop a successful market approach.

This article will explore the key differences between technical and fundamental analysis, their advantages and disadvantages, and how they can be used together for a more comprehensive investment strategy.
What is Technical Analysis?
Definition
Technical analysis is a method used to evaluate securities by analyzing past market data, primarily price movements and trading volume. It assumes that all available information is already reflected in the price and that historical trends tend to repeat themselves.

Key Principles of Technical Analysis
- Market Price Reflects Everything: Technical analysts believe that all known information (economic, political, psychological) is already embedded in a stock’s price.
- Prices Move in Trends: Markets tend to follow established trends, whether up, down, or sideways.
- History Repeats Itself: Market patterns, once established, are likely to recur over time.
Common Technical Analysis Tools
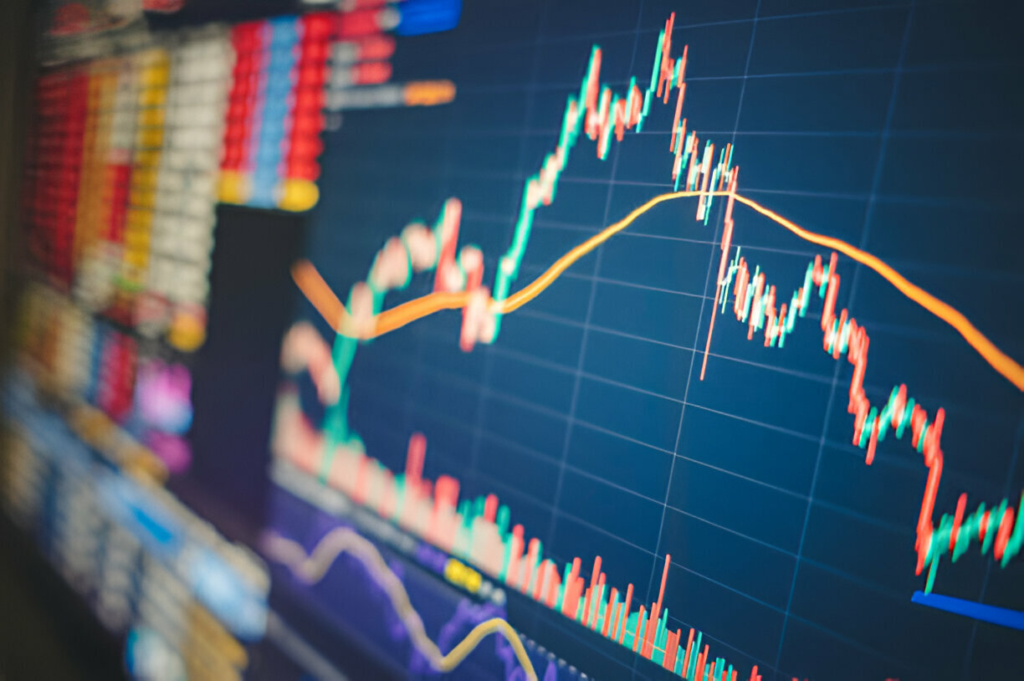
- Charts: Line, bar, and candlestick charts help visualize price movements.
- Indicators and Oscillators:
- Moving Averages (SMA, EMA)
- Relative Strength Index (RSI)
- Bollinger Bands
- MACD (Moving Average Convergence Divergence)
- Support and Resistance Levels: These indicate price points where buying or selling pressure historically causes reversals.
- Chart Patterns: Head and shoulders, double tops/bottoms, triangles, and flags signal potential market moves.
Advantages of Technical Analysis
- Short-Term Focus: Ideal for day traders and swing traders.
- Works in Any Market: Can be applied to stocks, forex, crypto, and commodities.
- Clear Entry and Exit Points: Helps traders make precise decisions.
Disadvantages of Technical Analysis
- Ignores Fundamental Data: Does not consider economic reports, earnings, or news.
- Subjectivity: Interpretation of charts can vary between traders.
- Not Always Reliable: False signals and sudden market shifts can disrupt technical strategies.
What is Fundamental Analysis?
Definition
Fundamental analysis evaluates a security’s intrinsic value by analyzing economic, financial, and qualitative factors. It aims to determine whether an asset is overvalued or undervalued based on real-world data.
Key Factors in Fundamental Analysis
- Macroeconomic Indicators: GDP growth, inflation, employment data, interest rates, and geopolitical events.
- Company Financials:
- Earnings per Share (EPS)
- Price-to-Earnings Ratio (P/E)
- Return on Equity (ROE)
- Debt-to-Equity Ratio
- Industry and Market Conditions: Industry trends, competitive positioning, and overall market health.
- Management and Corporate Governance: The efficiency and ethics of a company’s leadership.
Fundamental Analysis Tools
- Financial Statements: Balance sheet, income statement, and cash flow statement.
- Economic Reports: Central bank policies, employment data, and inflation reports.
- News and Events: Earnings reports, company announcements, mergers, and acquisitions.
Advantages of Fundamental Analysis
- Long-Term Perspective: Ideal for investors who hold assets for years.
- Helps Identify Undervalued Stocks: Supports value investing strategies.
- Provides Comprehensive Insights: Factors in real-world economic conditions.
Disadvantages of Fundamental Analysis
- Not Ideal for Short-Term Trading: Stock prices may not immediately reflect intrinsic values.
- Complex and Time-Consuming: Requires deep research into multiple factors.
- Market Sentiment Can Override Fundamentals: Stocks can remain overvalued or undervalued for extended periods.
Key Differences Between Technical and Fundamental Analysis
| Factor | Technical Analysis | Fundamental Analysis |
|---|---|---|
| Focus | Price action and trading volume | Company financials, economic indicators |
| Time Horizon | Short-term (day trading, swing trading) | Long-term (investing, value investing) |
| Data Used | Charts, indicators, patterns | Earnings, economic reports, management |
| Key Belief | Price movements follow trends | Market mispricing provides opportunities |
| Primary Tools | Moving averages, RSI, MACD, candlestick charts | Balance sheets, income statements, P/E ratio |
| Market Relevance | All markets (stocks, forex, crypto) | Mostly stocks and long-term assets |
Can Technical and Fundamental Analysis Be Used Together?
Yes! Many traders and investors combine both approaches for a more comprehensive strategy.
How to Integrate Both Analyses
- Use Fundamental Analysis for Stock Selection: Identify strong companies with solid financials.
- Apply Technical Analysis for Entry/Exit Points: Use charts to time the best moments to buy or sell.
- Monitor Economic Conditions: Stay aware of macroeconomic trends that can impact market movements.
- Adjust Strategies Based on Market Type: Bull markets may favor technical analysis, while bear markets may require fundamental insights.
Conclusion
Both technical analysis and fundamental analysis have their strengths and weaknesses. While technical analysis is better suited for short-term traders who rely on price patterns, fundamental analysis is ideal for long-term investors focusing on intrinsic value. Understanding both methodologies and combining them can enhance decision-making, reduce risks, and improve overall investment performance.
FAQ (Frequently Asked Questions)
1. Which is better: Technical or Fundamental Analysis?
There is no definitive answer. Technical analysis is ideal for short-term trading, while fundamental analysis is better for long-term investing. A combination of both can be highly effective.
2. Can I use technical analysis for long-term investments?
Yes, but it’s not recommended alone. Long-term investors should prioritize fundamental analysis while using technical indicators for optimal entry and exit points.
3. Do professional traders use both technical and fundamental analysis?
Yes, many experienced traders and investors integrate both methodologies to maximize their market understanding and profitability.
4. Is technical analysis reliable?
Technical analysis can be effective but is not foolproof. Market conditions, external factors, and human psychology can create false signals.
5. What are the best indicators for technical analysis?
Some popular indicators include Moving Averages, RSI, MACD, Bollinger Bands, and Fibonacci Retracement.
6. How often should I conduct fundamental analysis?
Fundamental analysis should be done regularly, especially before making long-term investment decisions. Reviewing quarterly earnings reports, economic trends, and industry developments is essential.
7. Do cryptocurrencies follow technical or fundamental analysis?
Cryptocurrencies often respond more to technical analysis due to their high volatility, but fundamental factors like adoption, regulation, and technological advancements also play a role.
By understanding the differences and synergies between technical and fundamental analysis, traders and investors can make more informed decisions and optimize their market strategies for greater success.


An excellent article with so much useful information! I appreciate how this website provides
such great content.